


Designing CX Dashboard
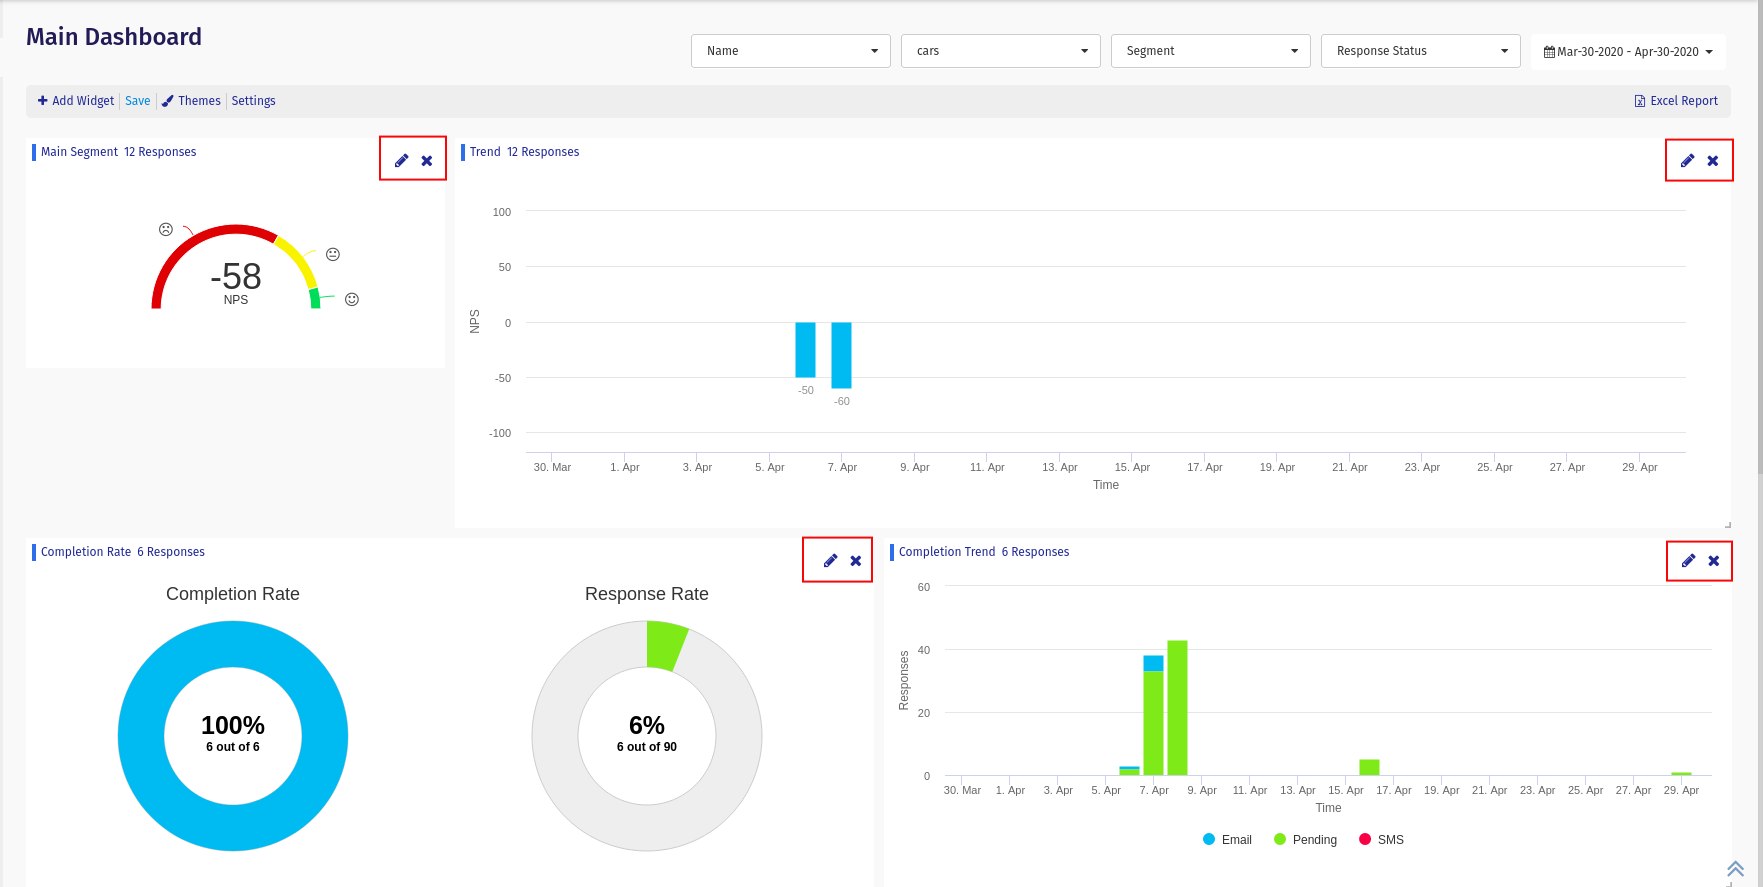
A CX Dashboard is a visual display of responses to your survey present in the Workspace. Dashboards extract data into graphs, charts, and other visualizations called widgets. These widgets can be added according to our requirements in an unlimited number of dashboards. So before designing the dashboards we should be able to answer the below questions.
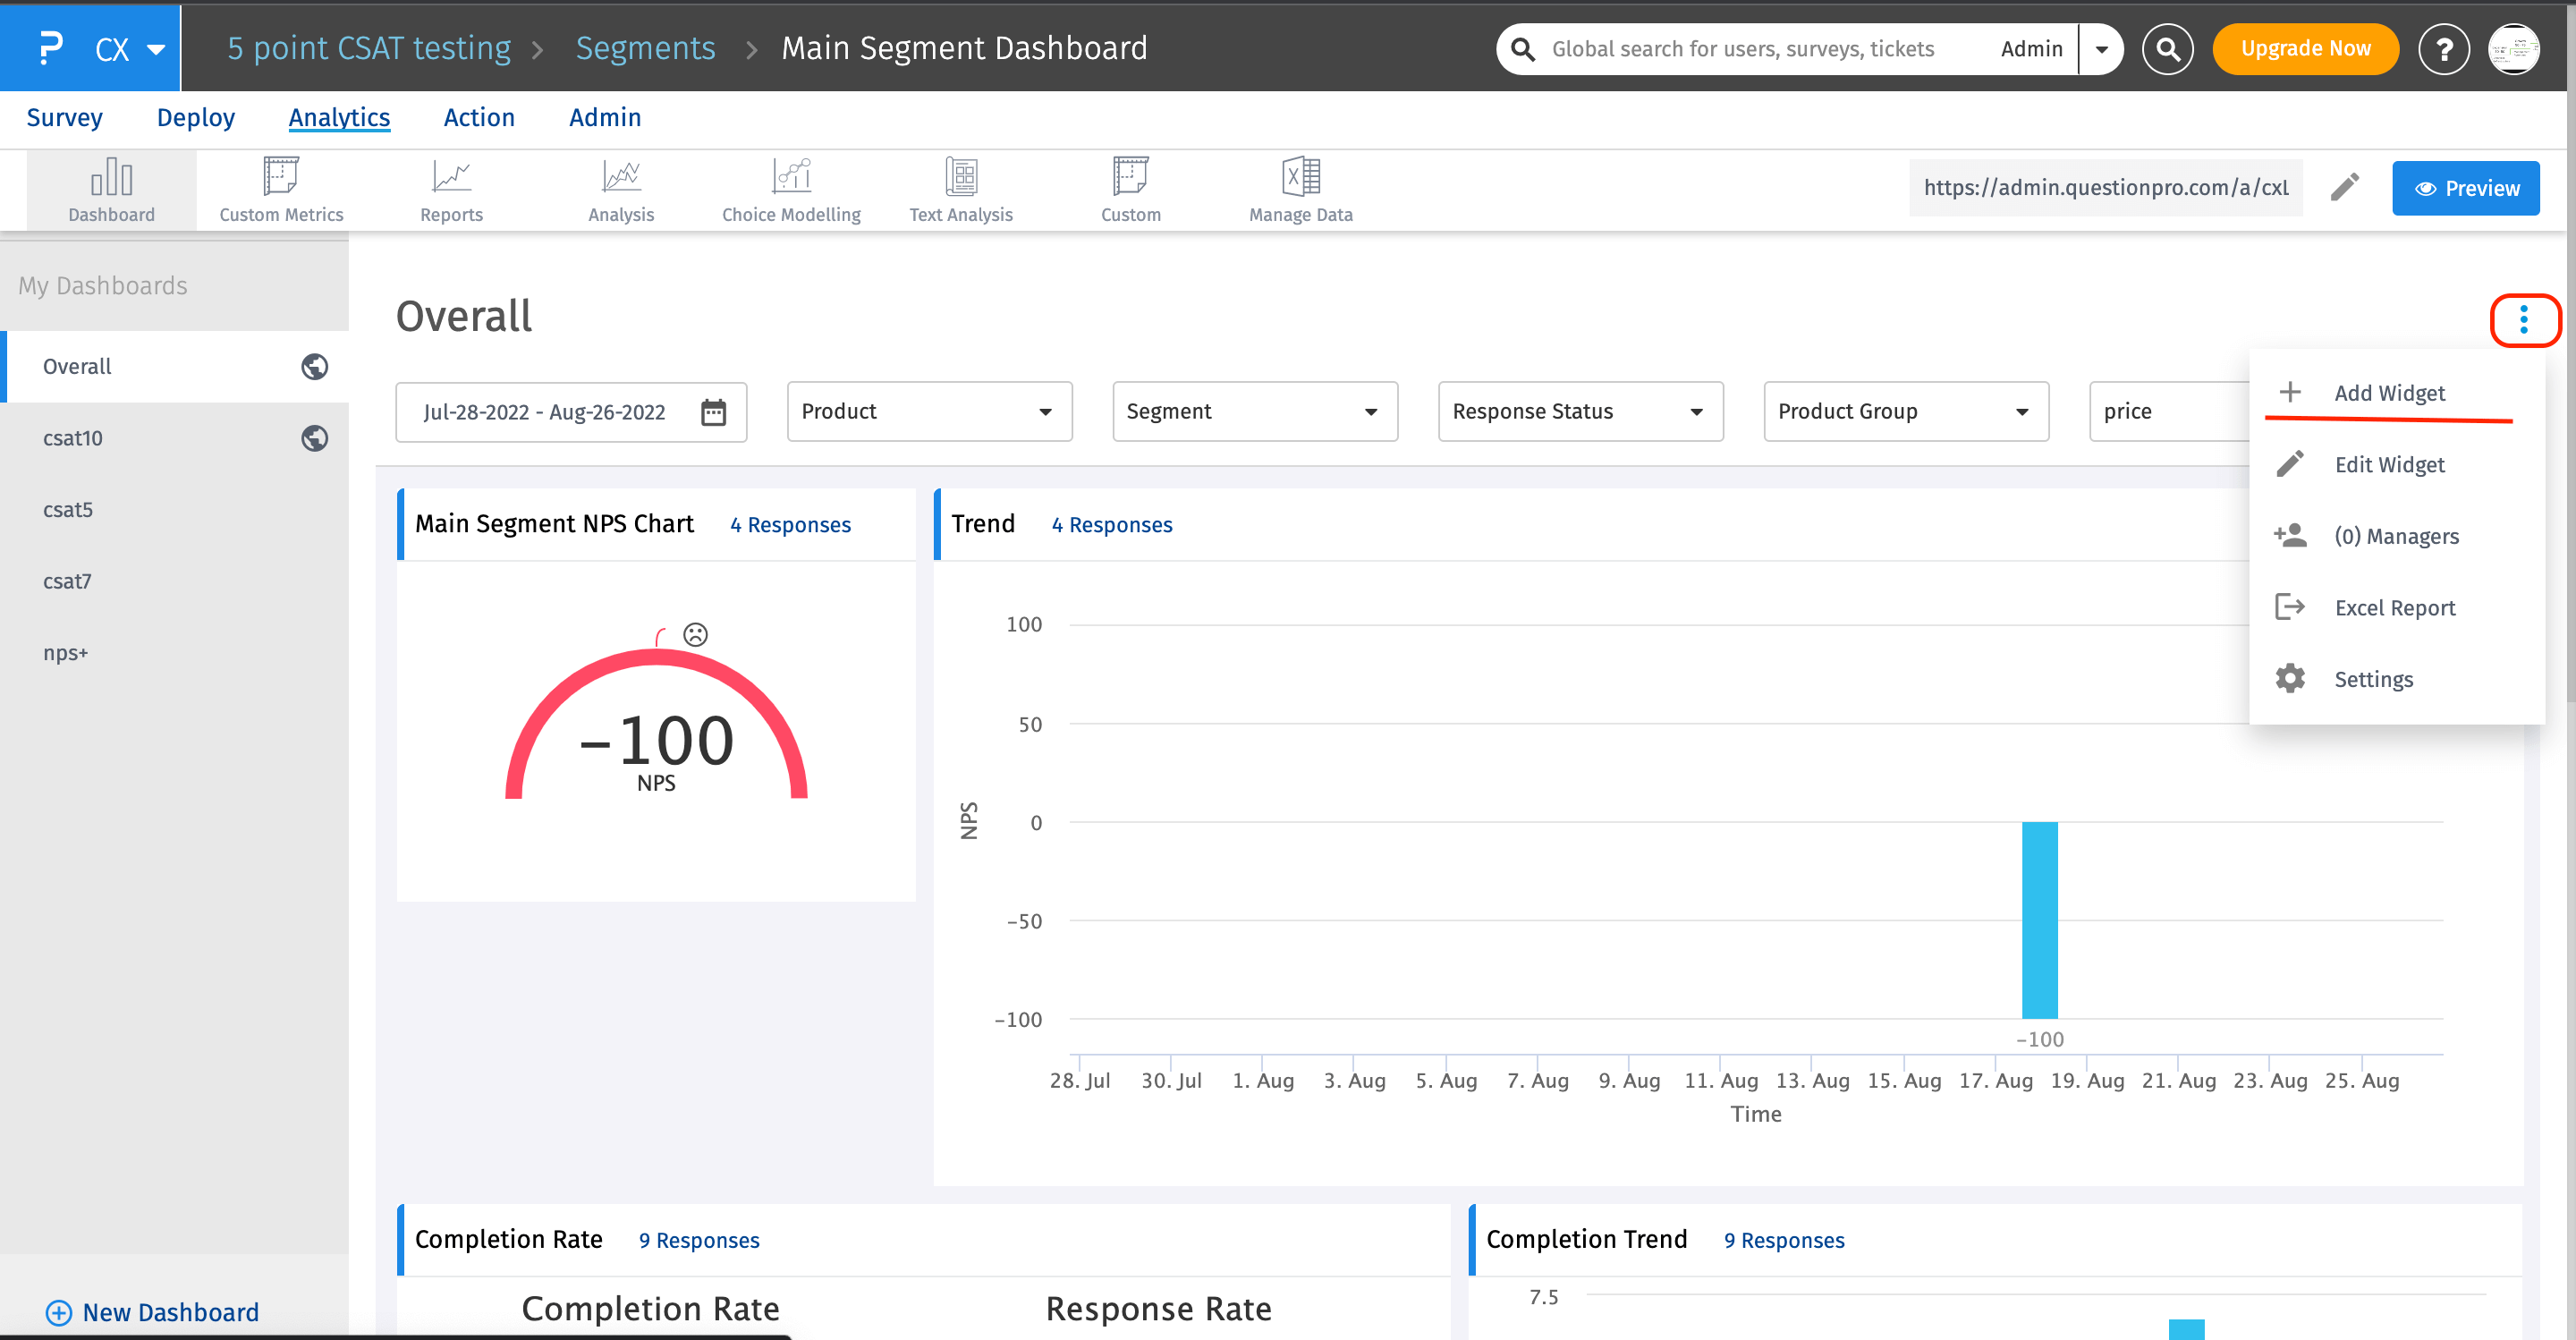
Click on the 3 dots that are present on the extreme right hand side of the screen, then choose the option Add Widget.
After clicking on Add Widget
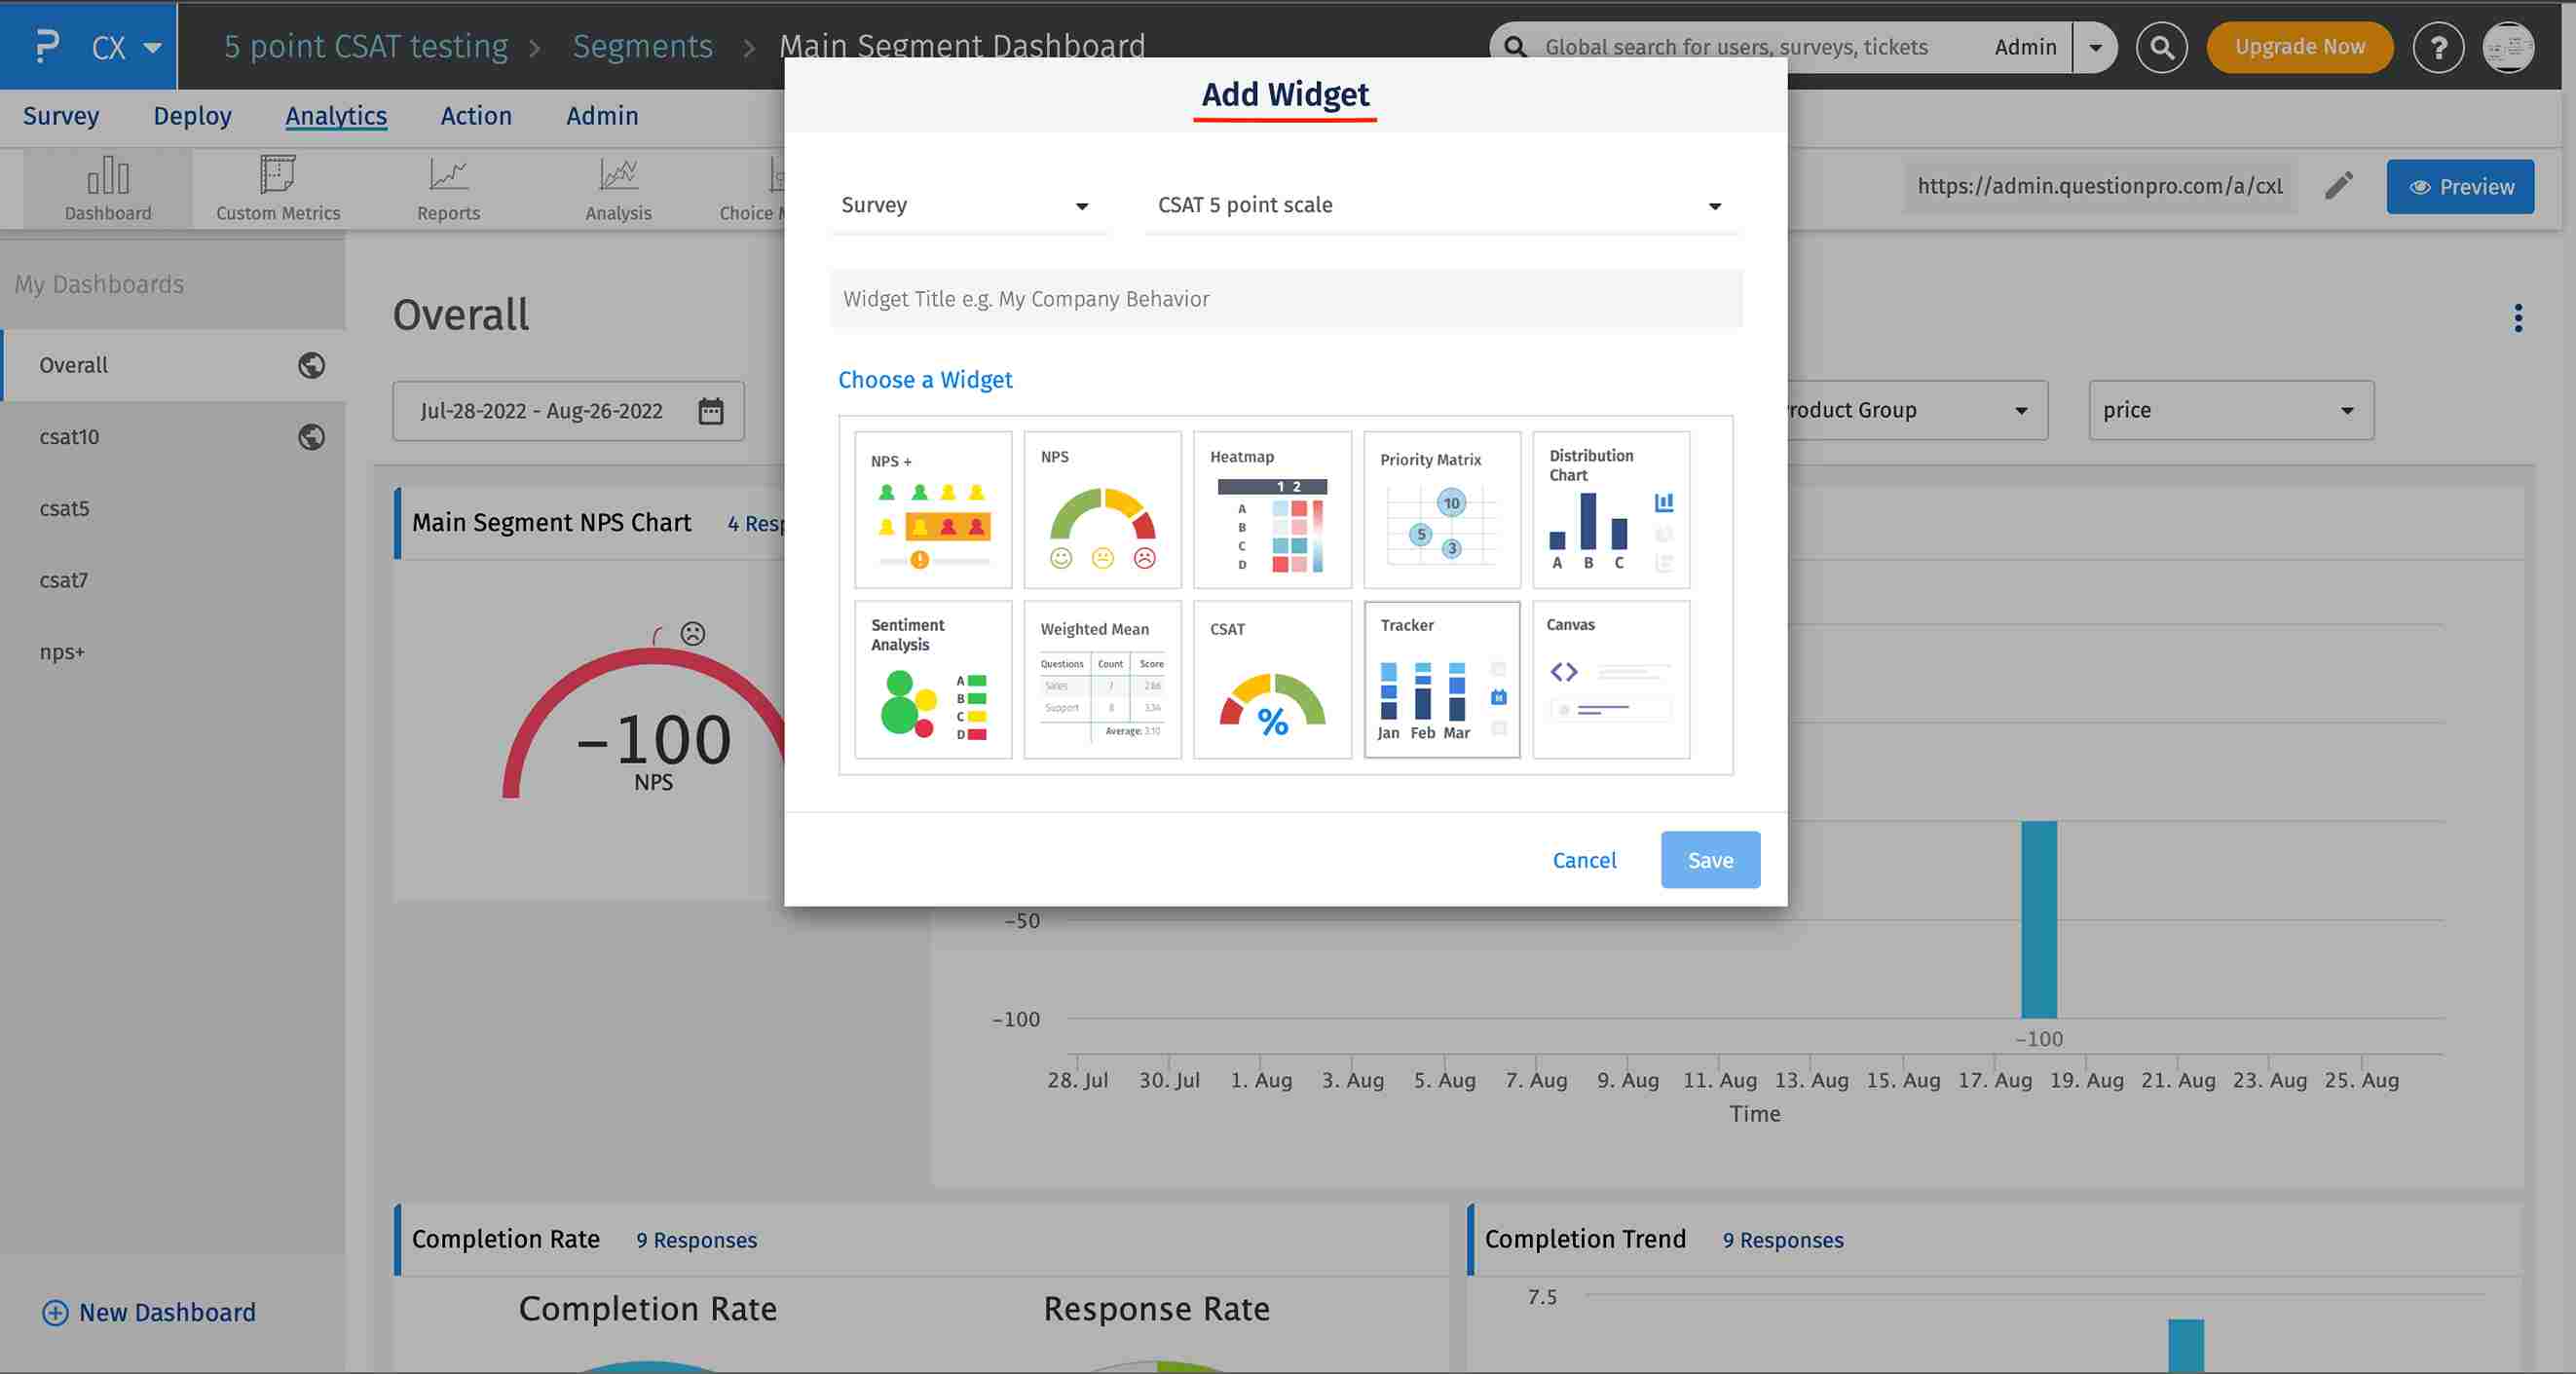
- Select segment/survey
- Choose segment/survey name from the list of segments/surveys
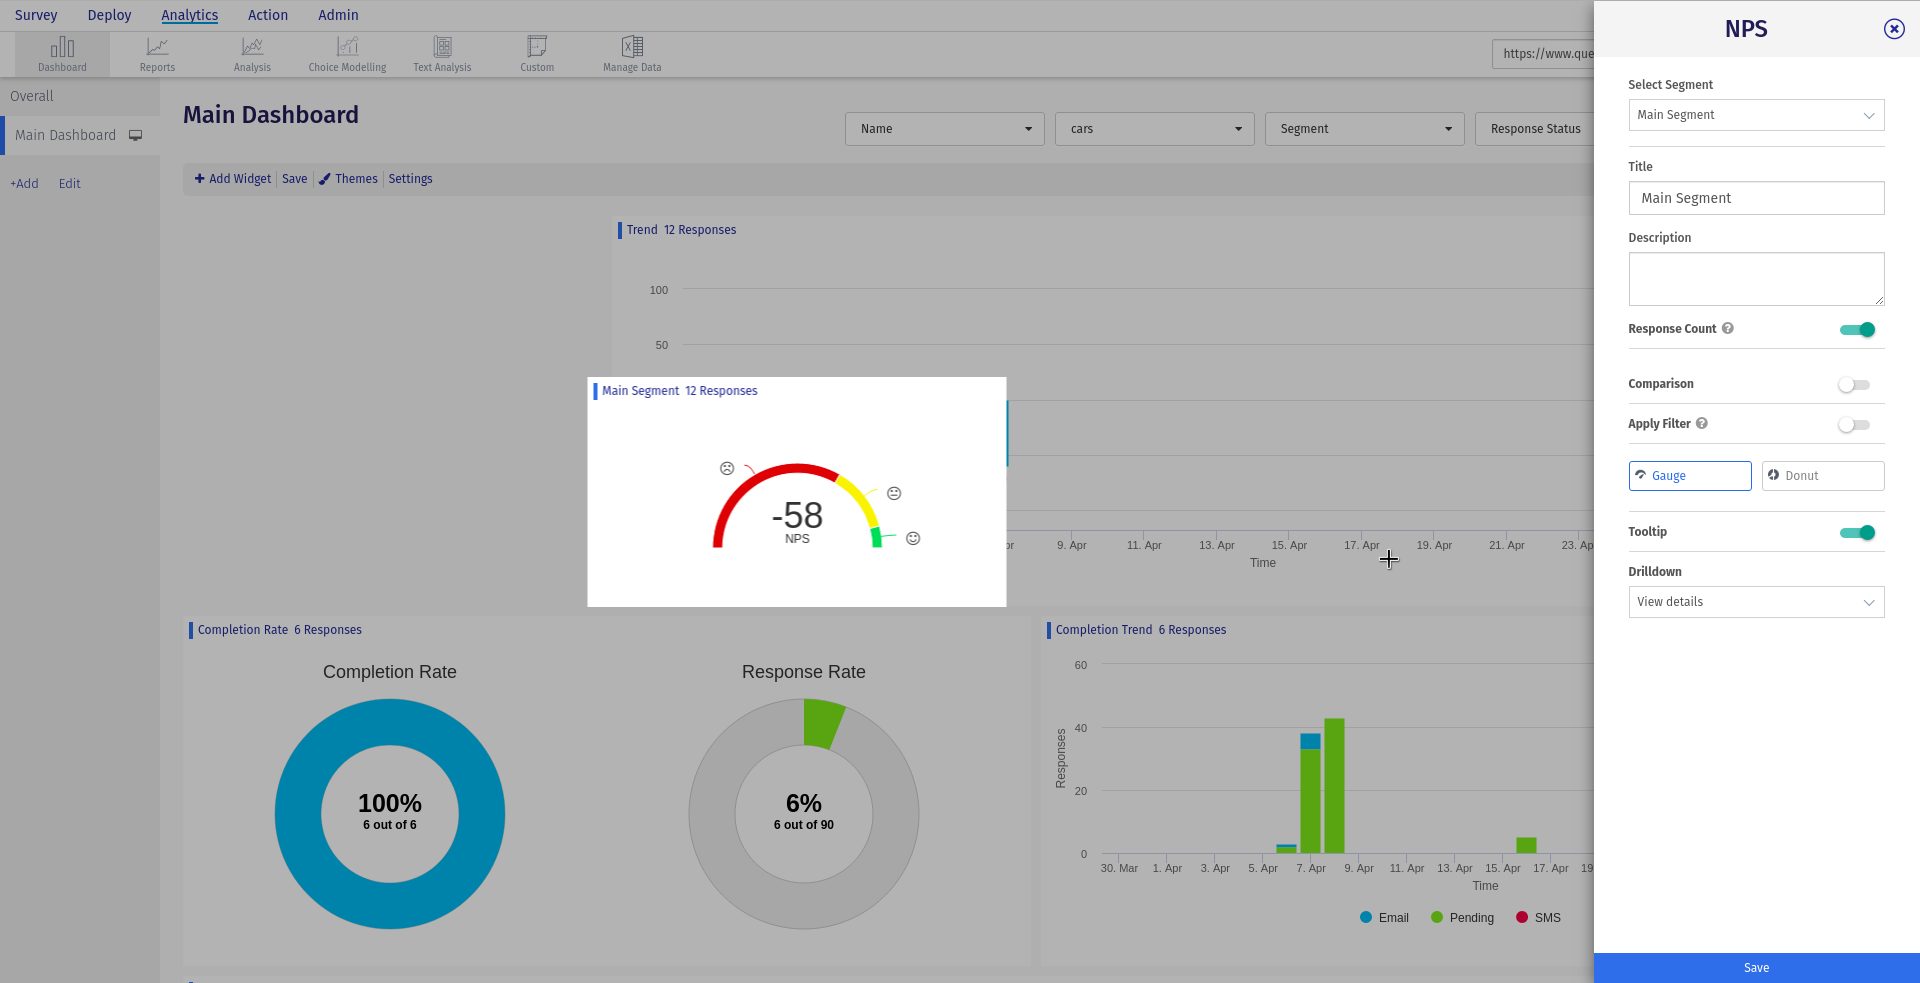
- Provide a suitable widget title
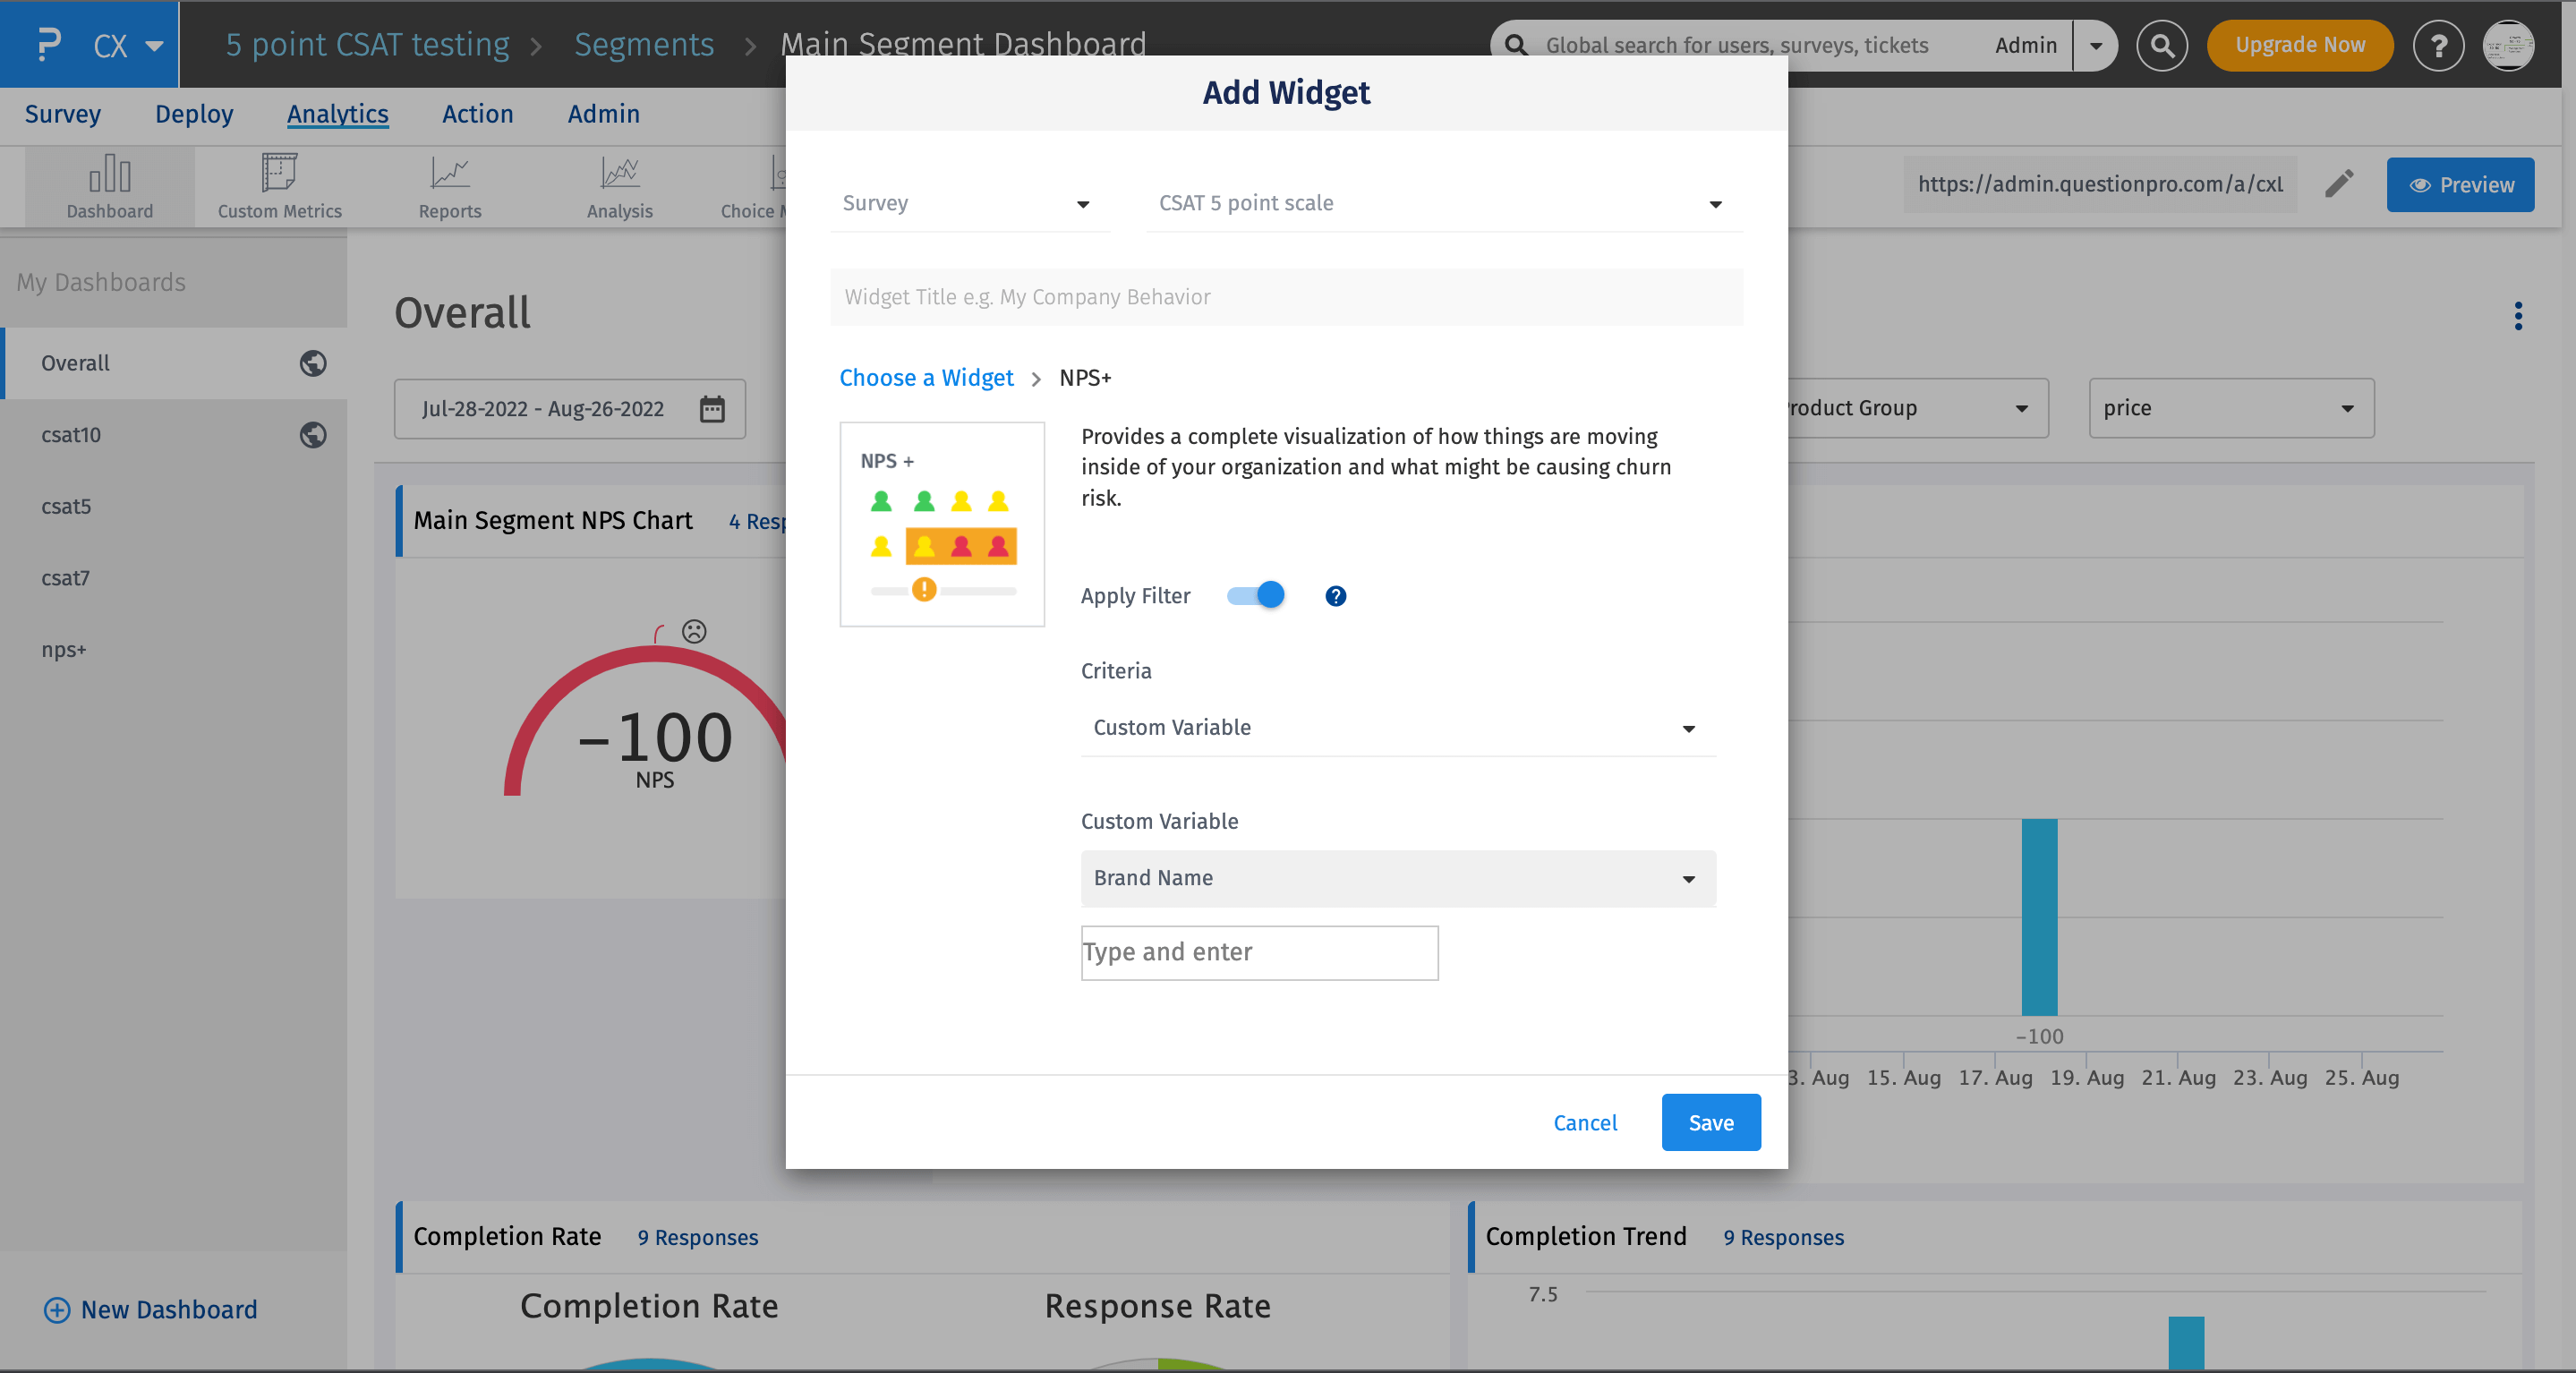
- After that we will be taken to another page where you can choose filters or other options based upon your selection of widget and type survey/segment. Options might differ based on widget Suppose in my case I have selected Survey -> NPS+
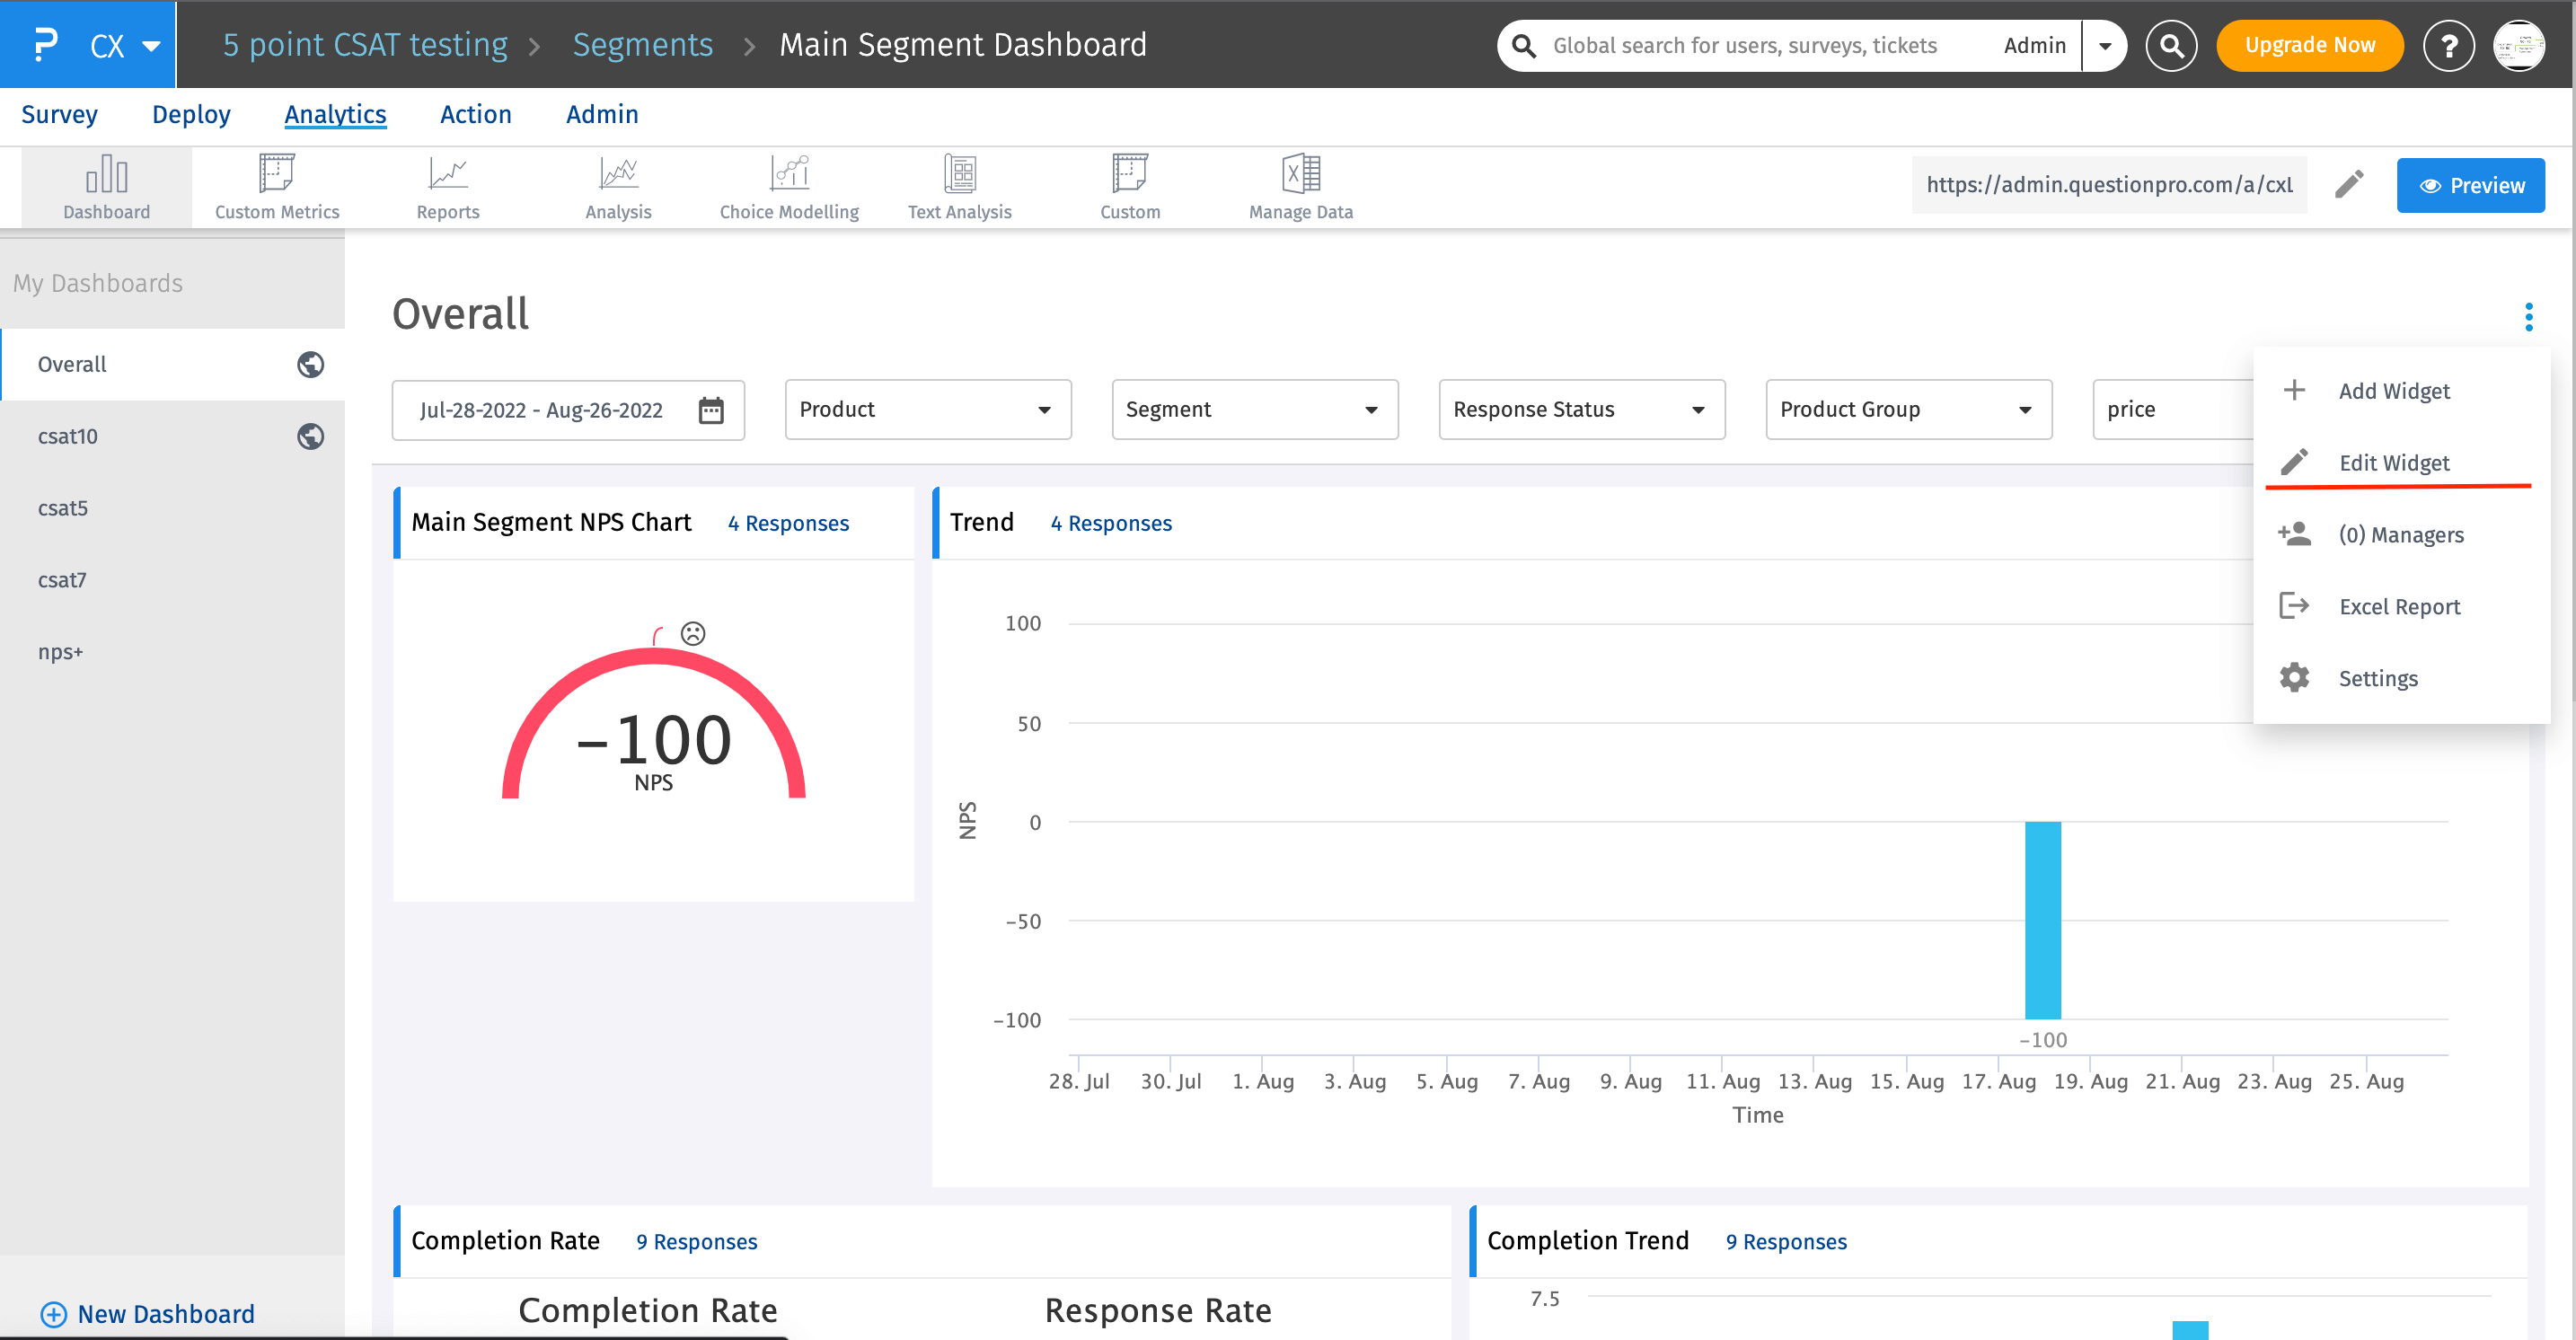
Click on the 3 dots that are present on the extreme right hand side of the screen, then choose option Edit Widget.
After clicking on Edit Dashboard, all the widgets will be enabled with edit and remove option
Each will widget can have different options according to its functionality
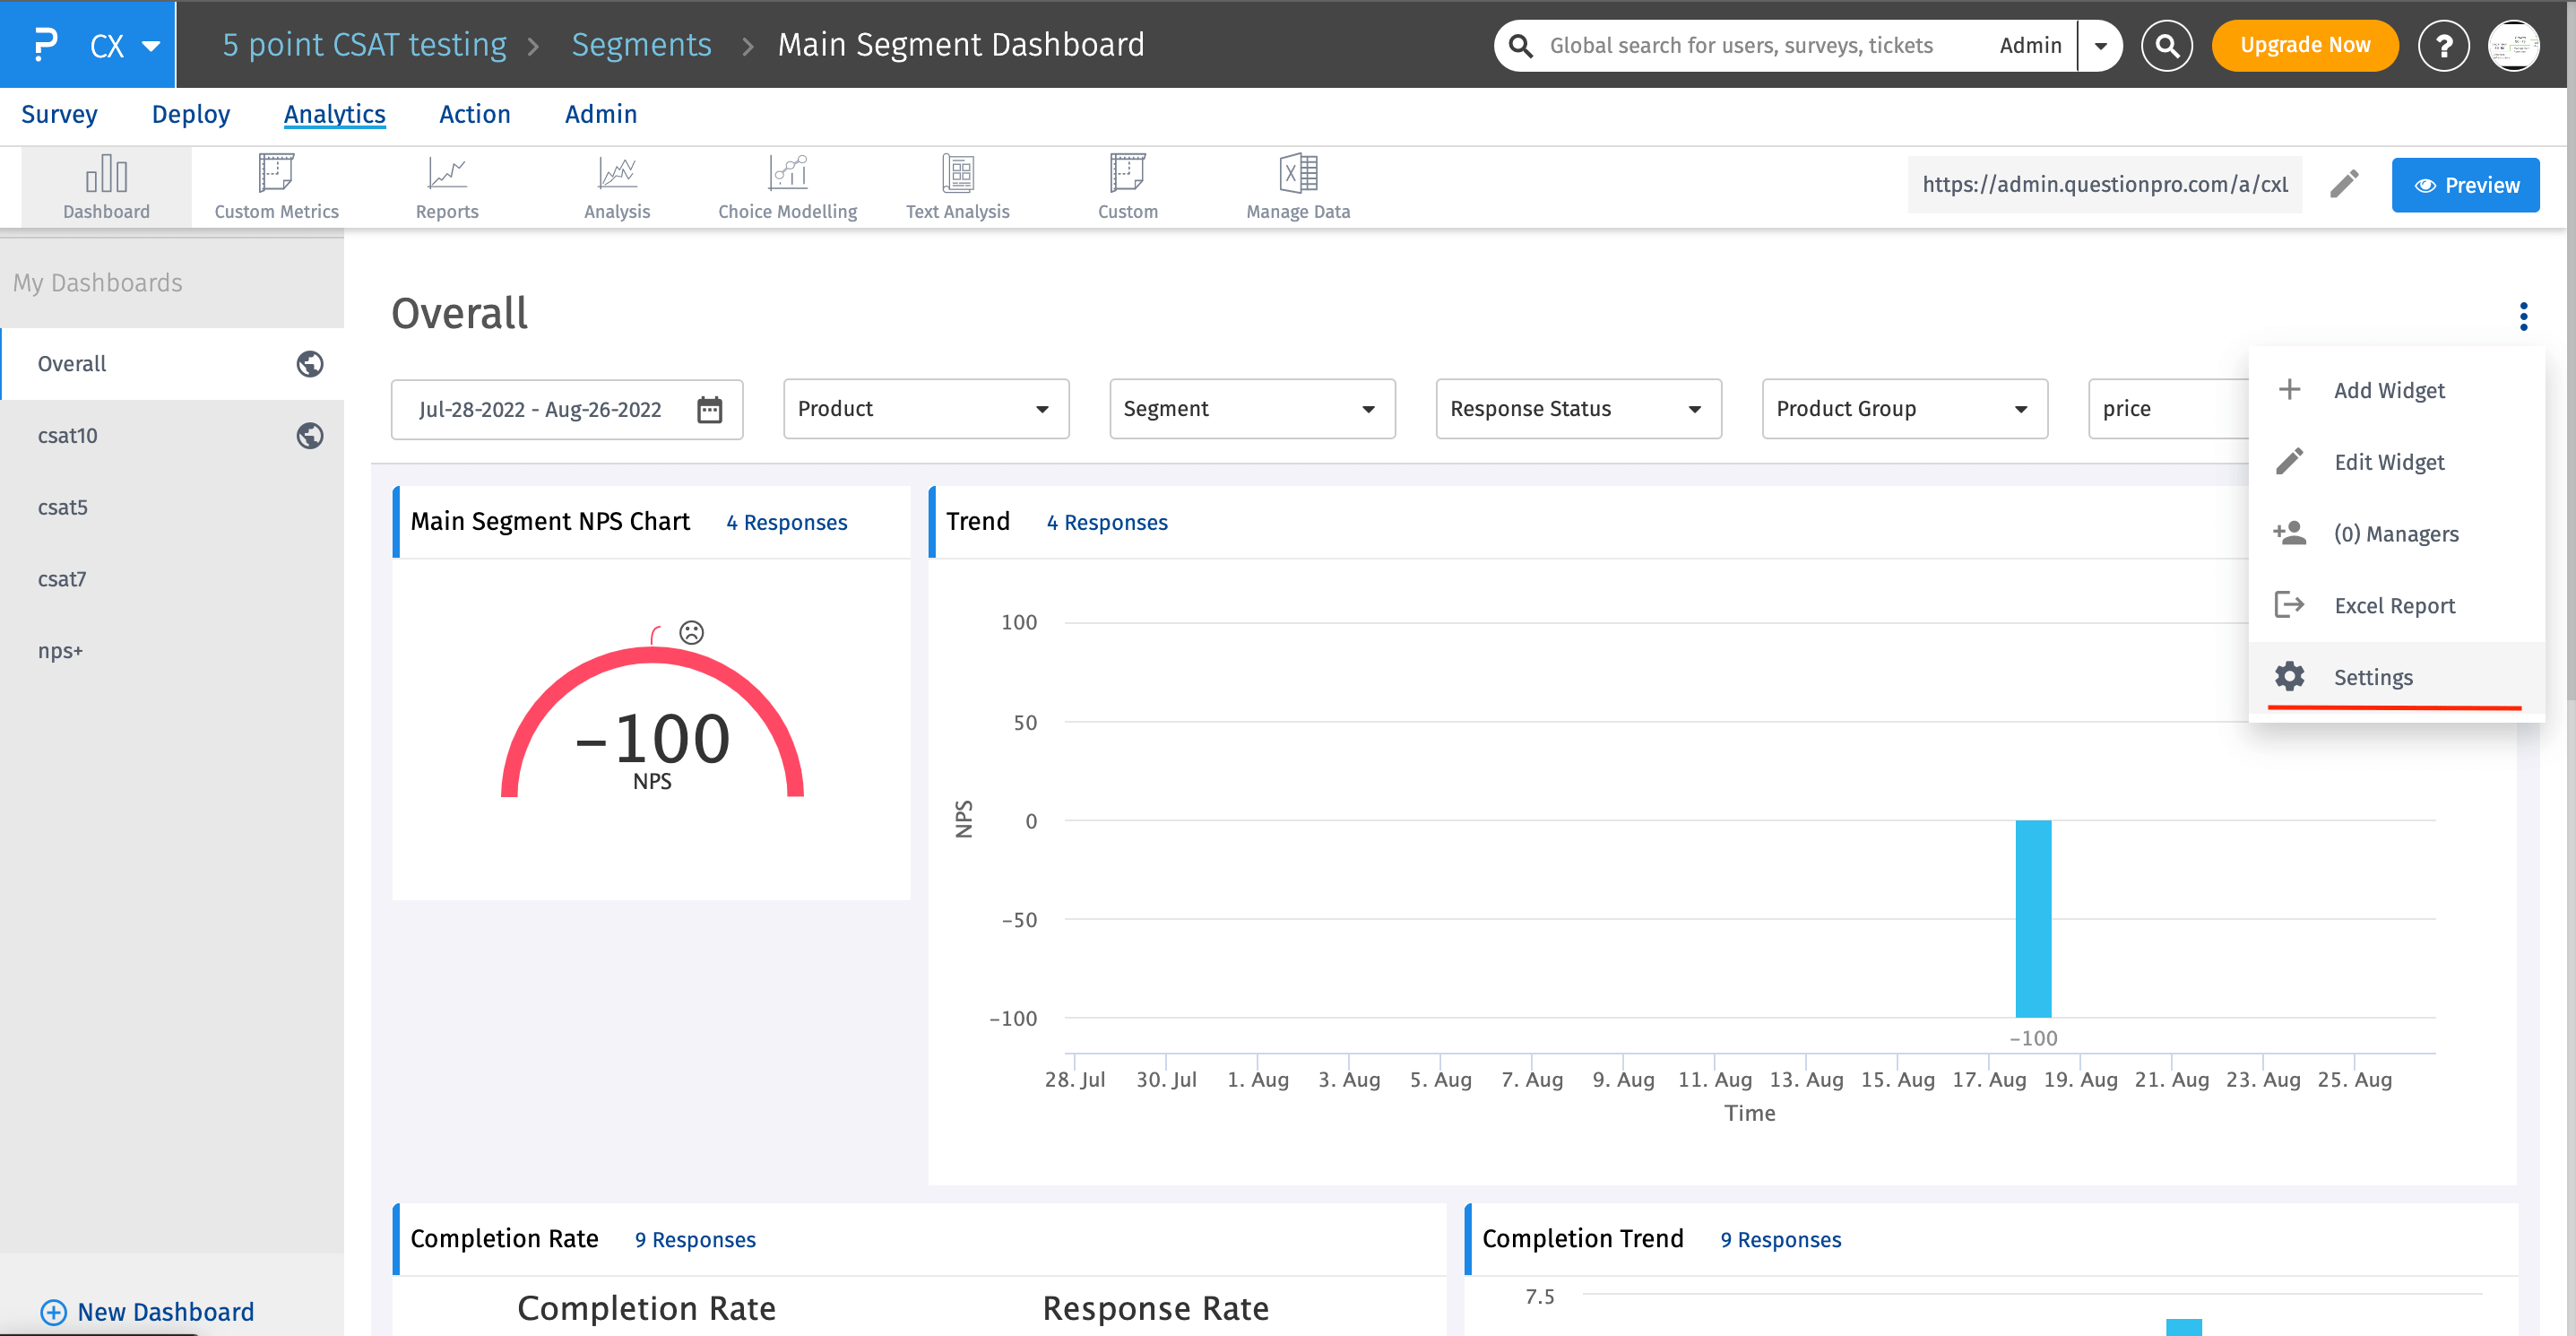
Click on the 3 dots that are present on the extreme right hand side of the screen, then choose option Settings. From here you will land on the Themes page.
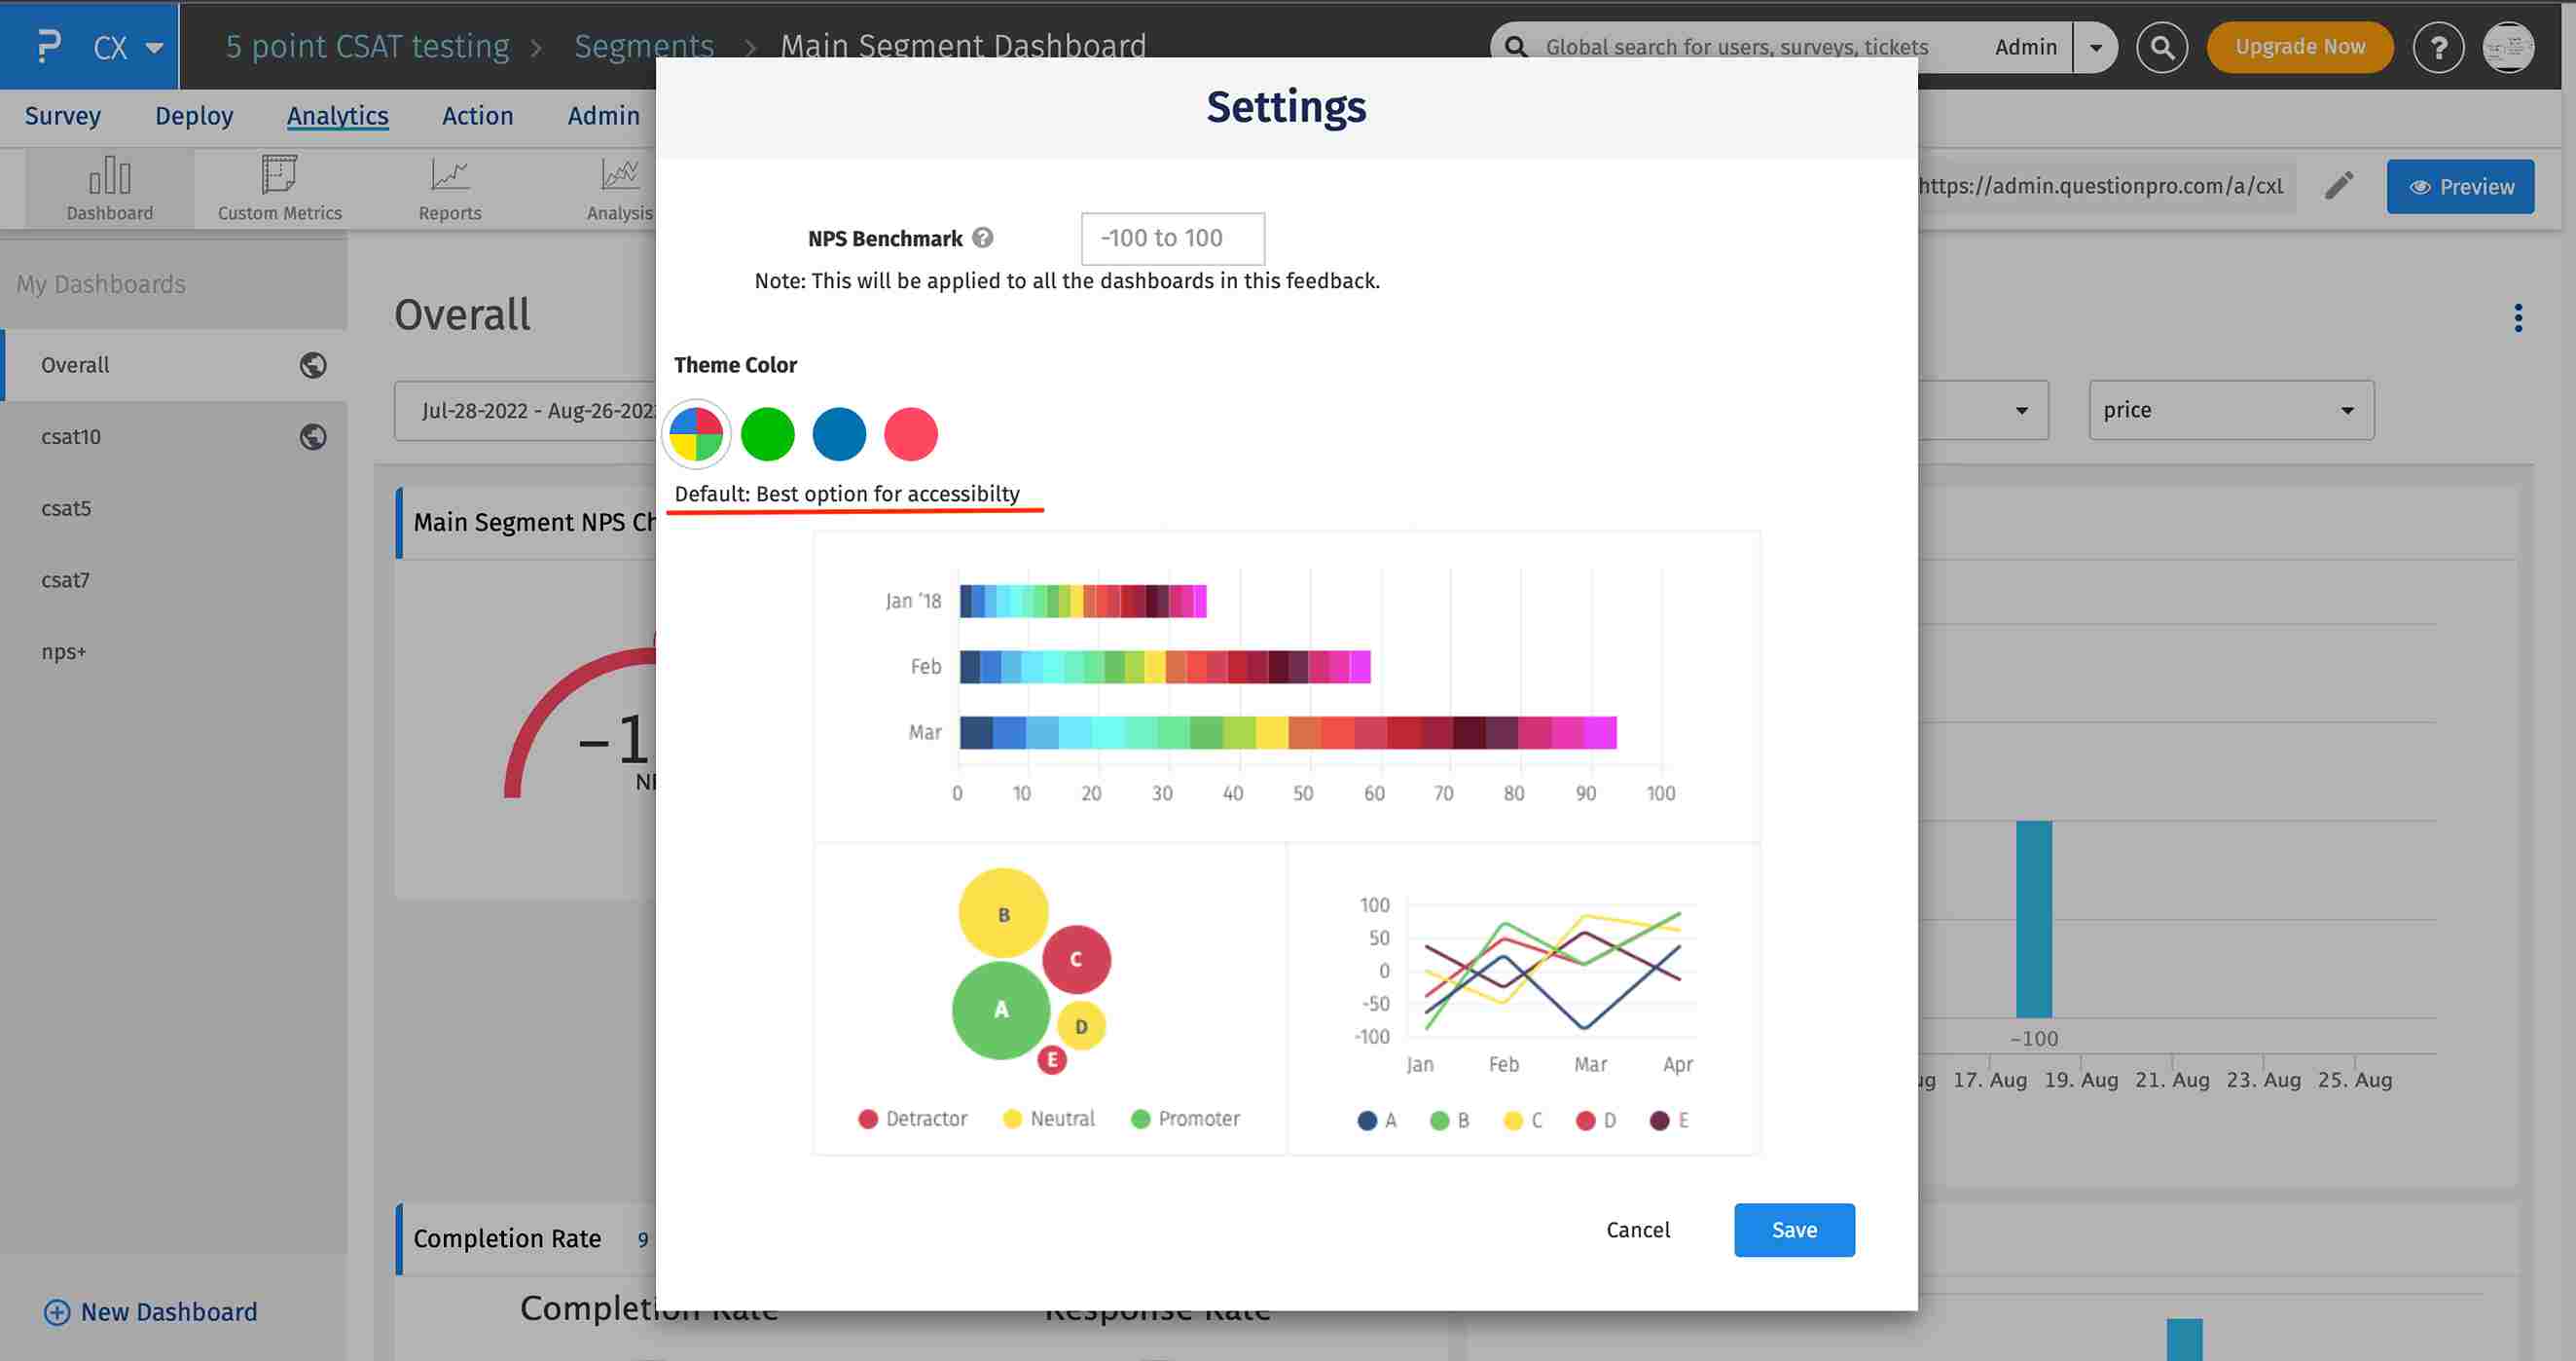
- You can change theme color from the options
This feature/tools described here are available with the following license(s) :